Appearance
Search Analytics
Search Analytics is a tool that offers insight into the behavior of your search requests. It is split into several tabs, each designed to dive deeper into a particular aspect of your search data.
Search Analytics gathers information from search requests that contain an identified user - either with an Authenticated ID or a Temporary ID. This means that Search Analytics does not reflect searches made by anonymous users.
Learn more about why anonymous data is filtered out of Search Analytics in our FAQ, here.
Currently, Search Analytics only reflects product searches. This means that it will not reflect any content search requests received to your dataset. The ability to analyze content searches is a forthcoming feature.
Search Analytics data can be filtered by language, currency, channel, subchannel, and classification, all according to what is being tracked on your dataset. The data shown on the page will likewise reflect the timeframe selected at the top of the screen.
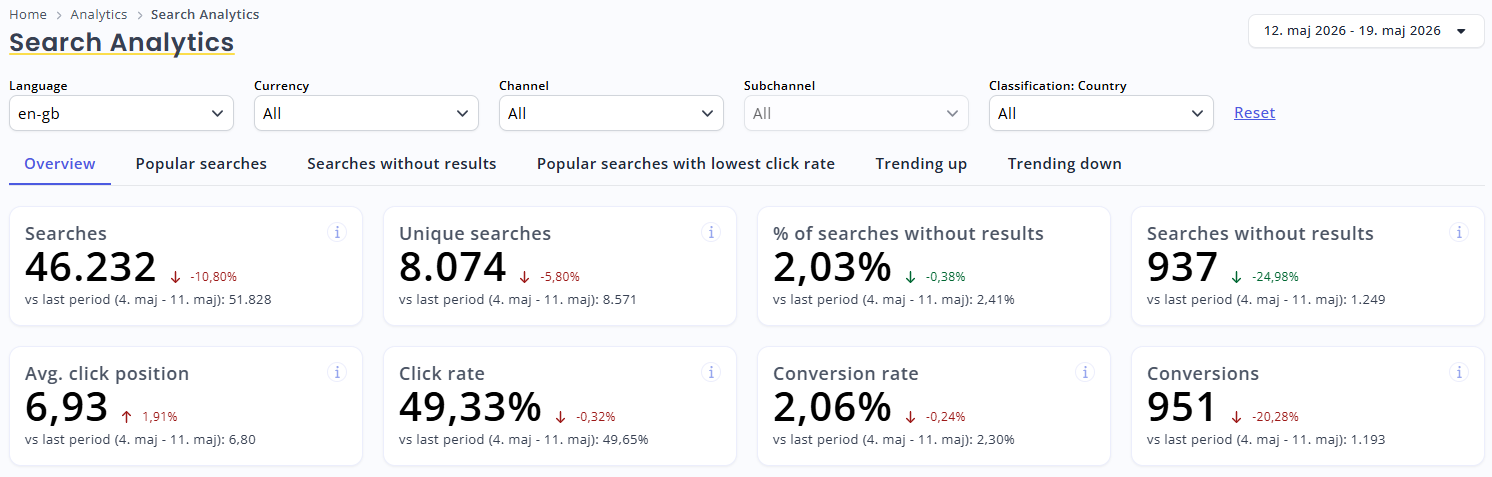
Filter your data by language, currency, channel, subchannel, and classifications.
Use the date picker at the top right to change the timespan of data you want to view.
Tracking Clicks
Relewise does not directly track clicks. Instead, we infer that a click has happened by looking at a chain of events that contains the following:
- User is Non-Anonymous
- Relewise receives a Search request, and returns a list of Products as results
- Relewise receives a Product View tracking request that contains the ID of one of the Products that was returned in the Search
When this happens, the Relewise engine can infer that the User performed a Search, got results, and clicked one of the Products in the results.
Since Anonymous User data cannot be connected to behavior, we do not track it in the Search Analytics; this goes for click tracking as well.
Overview
The Overview tab provides a general overview of search behavior, including how many searches have been made (both unique and in total), how many searches have returned zero results, search click rate and click position, as well as information on conversions.
You can also export Search Analytics across multiple languages and markets into a single CSV file, which is useful when comparing query popularity and behavior across storefronts.
Further down, the page displays two graphs: The first provides an overview of the aforementioned metrics over time, and the other displays the average click position over time. This information can be exported as either an image or a CSV file.
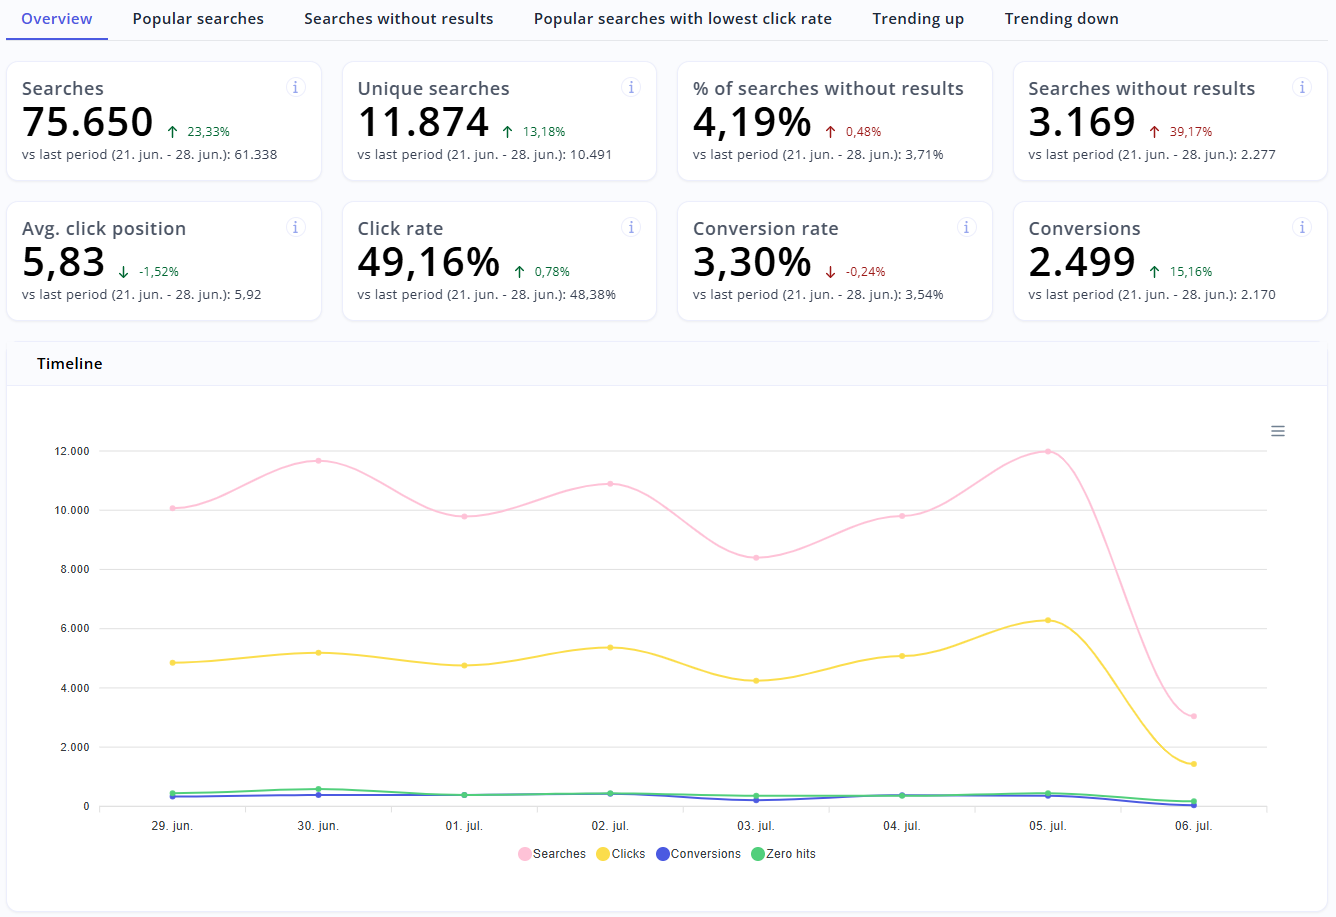
You can export data from the Overview graphs by clicking the menu on the top right of the graph.
Avg. Click Position
The average click position denotes where in the list of results the average user clicked on a product. The lower the number, the less the user had to scroll before finding something that was of interest to them in the search results. Typically, you should strive to reduce this number as much as possible, by looking at the popular search terms and trying to optimize for them. However, many of the most popular search terms are going to be generic in nature, and depending on the type of business you run, these generic search terms may be used more as exploratory searches to inspire the user, than strictly looking for specific products. As such, a balance must be struck between optimizing for a lower average click position on one hand, and allowing generic searches to be viable as exploratory tools on the other.
Click Position and Faceting
When faceting on a search, each individual facet that you select will prompt a new search request to be sent to Relewise. This means that the average click position takes the facet into account, so that a product that may have been position 42 in the original search, and which is faceted into position 3, will be counted as position 3 for the purpose of the avg. click position when the user engages with it.
Click Rate
Click Rate refers to the percentage of searches where a user subsequently clicks on a product to view it. This is calculated by correlating a user's most recent search results against the next product view tracking that the same user performs. Keep in mind that when a user is faceting on a search, said search will be re-sent multiple times, which means that a user who types in a search request and then facets on it three times before clicking, will have an individual click rate of 25% - four searches to one click.
Common reasons for low click rates include, but are not limited to:
- Multiple requests sent due to Faceting
- A user typing a search into a search overlay before hitting enter and moving to a search page with more results - this will be two separate search requests
- Insufficient debounce in the search
Conversions
For the purpose of Search Analytics, Conversions refer to those sales that can be linked directly to a search made via Relewise. This means that the conversion rate on the Search Analytics page does not refer to all conversions made on the site, but rather, shows a correlation between a specific search term and how it converts into orders.
Specifically, the search analytics tool looks for the following string of actions to happen in order to track a conversion:
Product Search -> Product View Tracking -> Order Tracking
These events must be performed by the same non-anonymous user, and must, naturally, refer to a product that was found in the product search and tracked in both the product view and order tracking events.
If you ever experience that your Search Analytics has a suspicious lack of conversions, it may be due to one or more of the following:
- You are not tracking the User ID correctly somewhere in the aforementioned event chain
- You are importing most of your orders from a POS system, which will not contain user IDs, and which will not conform to the event chain listed above
- You are executing a Product Search and a Content Search at the same time, and your users are only using it for the content entities
Popular Searches
This tab displays an overview of the most popular searches within the given timespan, compared to the previous timespan. Each entry displays the number of searches, the number of clicks, the conversions registered for each search, average click position, click percentage, and conversion percentage.
This data can be exported by using the button on the top right.
Next to each number is a positive or negative percentage, which reflects whether the value has gone up or down relative to the previous period, alongside the relative percentage value of the change.
It is also possible to search for a given search term, to gain insight into its relative performance.
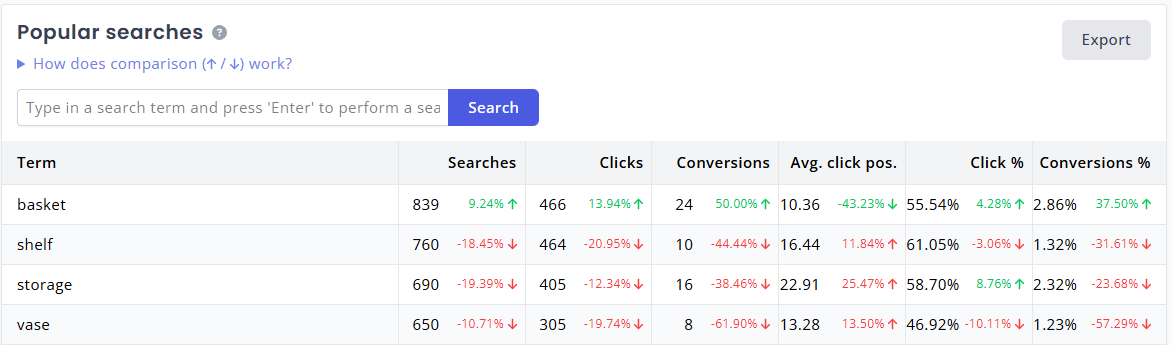
The Popular Searches tab displays the most popular search terms, and their associated metrics.
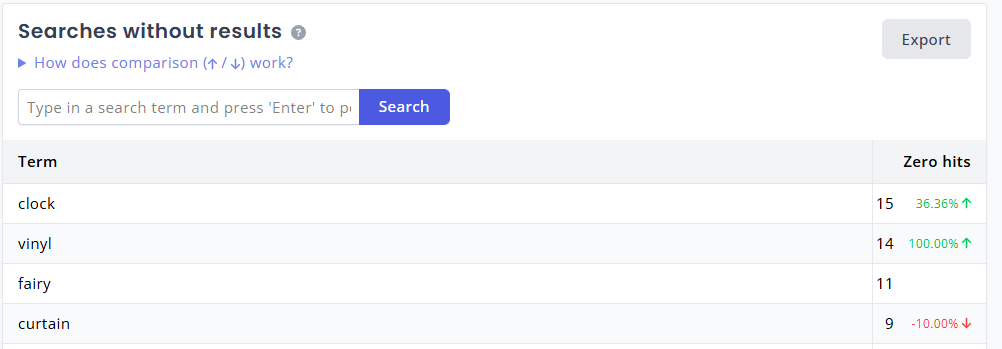
Searches Without Results
This tab displays the most common search terms that have returned zero results during the selected time period. Each term is listed with a "Zero hits" value next to it, as well as a positive or negative percentage. This reflects the number of times that users searched for this term within the selected time period, and a comparison to the number in the previous period.
The Searches without results tab is very useful for identifying cases where users expect a result but find none, which can be remedied through the use of synonyms, decompounding, or search term modifiers, or by enriching your data with more relevant keywords.
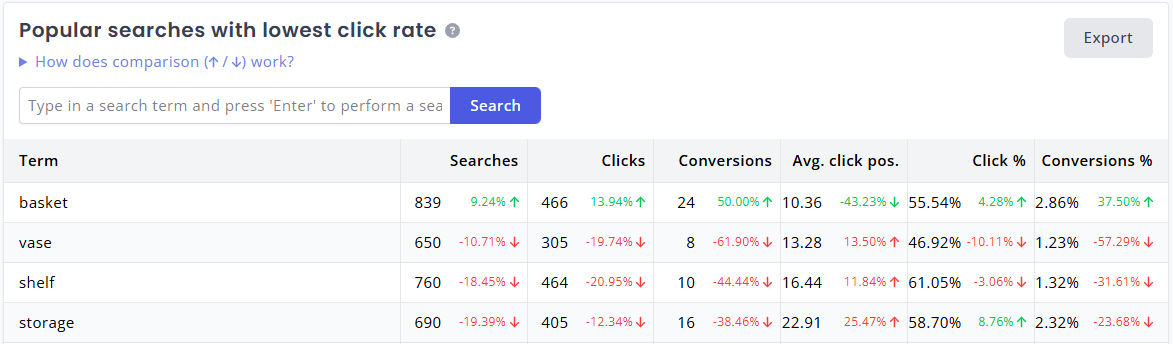
Popular Searches With Lowest Click Rate
This tab shows the most popular search terms, sorted by order of how often the search did not lead to a click.
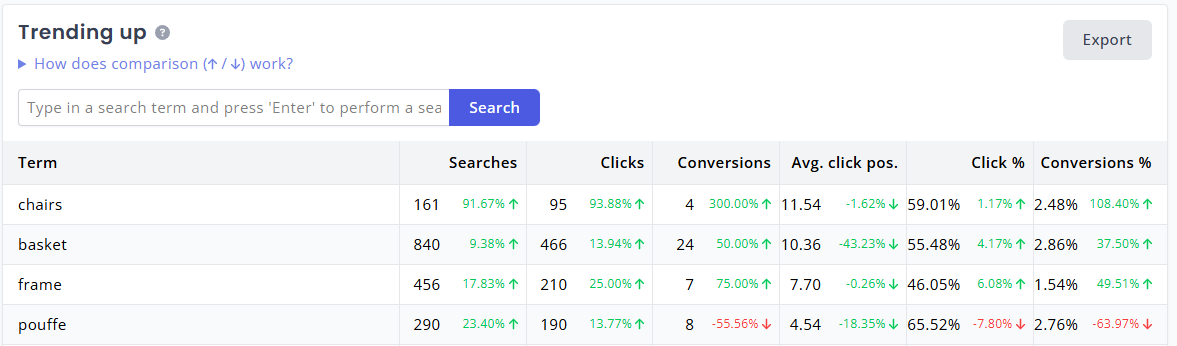
Trending Up
This tab shows the search terms with the biggest rise in popularity within the given time period, as compared to the previous time period.
This information may help guide marketing efforts, by showcasing fluctuations in product interest which can be taken advantage of using merchandising rules.
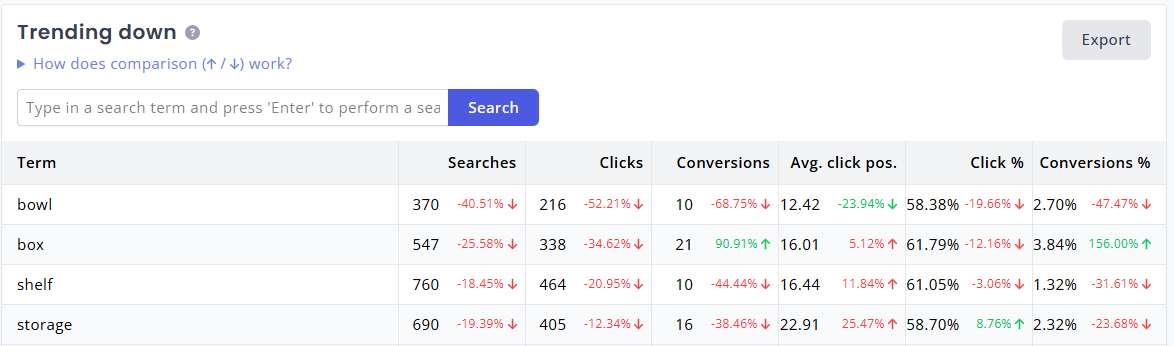
Trending Down
This tab shows the search terms with the biggest decline in popularity within the given time period, as compared to the previous time period.
This information may help guide marketing efforts, by showcasing fluctuations in product interest which can be taken advantage of using merchandising rules.