Appearance
Recommendations
On the Recommendations page, you get all the details about personalized recommendations presented to the users. This is shown in a live view that lets you see trends over time, as well as real-time data flowing into the system.
The top half of the page displays a graph view of recommendation types over time, broken down by type. It also displays a number of aggregate measures, such as how many items of a given entity type have been displayed, and how many impressions (that is, how many times a given recommendation slider has been rendered on the screen) have been made.
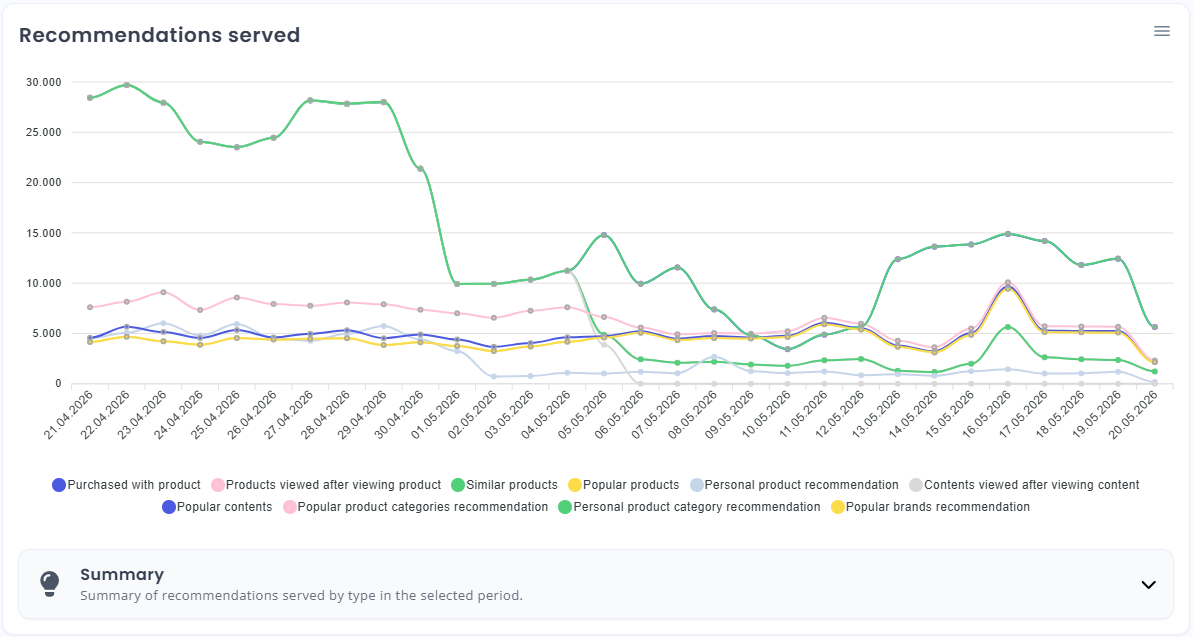
Overview of recommendations for selected time period.
Below the graph view, the live view displays the most recent recommendation requests being made, tracked in real time.
To save on resources, the Live View automatically disables after ten minutes of inactivity. This means that when you first visit the Live View page, you will need to hit the refresh button located beneath the graph to begin gathering data. Once you do so, the Live View will begin to pick up data from the site, and display it on the page. The Live View page shows the latest 30 queries made to the server.
It is possible to search for specific recommendations among those loaded and displayed in the list. It is also possible to filter the list by recommendation type and display location.
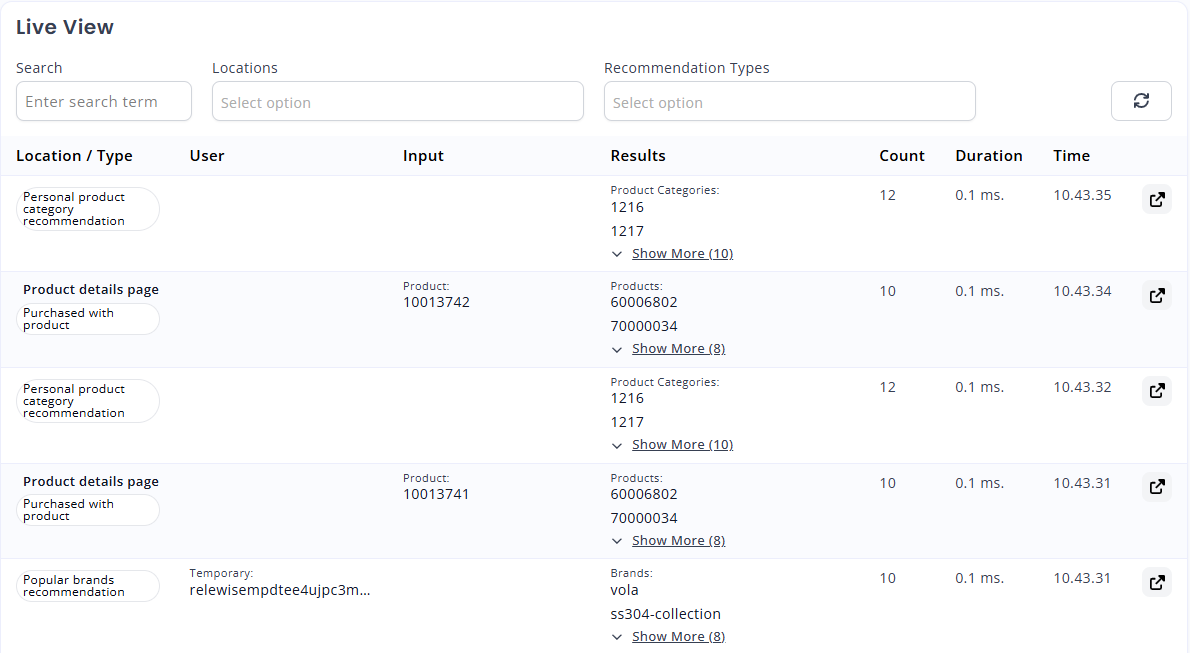
List of most recent recommendations.
For each recommendation in the list, you can see the recommendation type, display location, the user ID and identifiers, products recommended, any modifiers or filters applied, number of results, response time and a timestamp. Each line can be further inspected by clicking the Details icon to the right. The details include the actual JSON sent to Relewise, and both the list and the details can provide developers with valuable debug information.
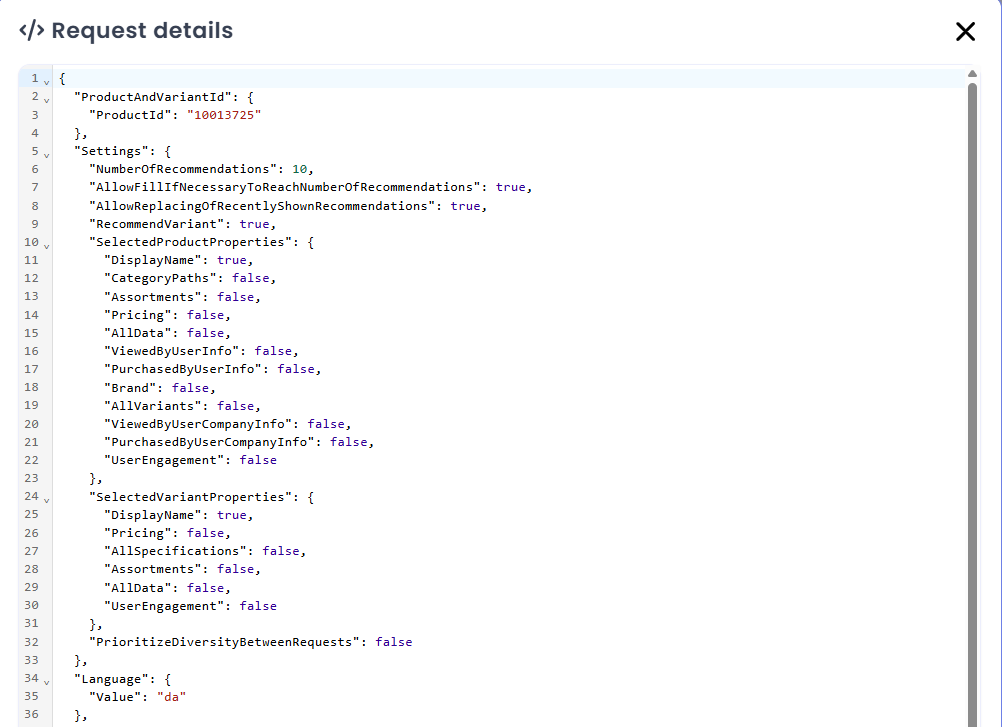
Example of tracking details.