Appearance
Analytics
The Analytics menu item has four subitems: Revenue, Search Analytics, Product Performance, and Analyzers.
Revenue
The Revenue page is where you get insight into how much revenue is generated on the site, and how much of it has been affected by personalized elements from Relewise.
Revenue Types
Front and center on the page is a graph that shows an overview of the time period selected at the top of the screen. This overview breaks the overall revenue down into four distinct types of revenue: Organic, Anonymous, Assisted, and Direct.
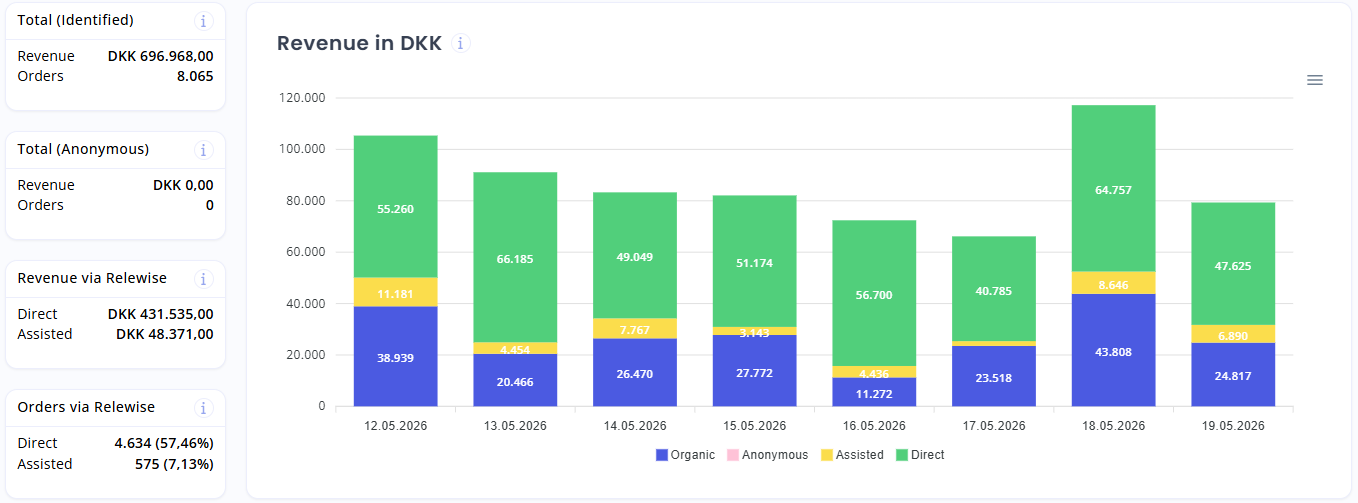
Overall performance metrics for Relewise
Organic Revenue
Organic Revenue is that which is registered as not having been affected by Relewise at all. In other words, at no point in the user journey did the user click on a recommendation offered by Relewise.
Anonymous Revenue
Anonymous Revenue is counted as revenue that is tracked from a user who has declined cookies on the website. Since this use is anonymous, there is no reliable way of knowing whether the user interacted with Relewise elements during their user-journey. Anonymous Revenue is likely to be a mix of organic, assisted, and direct revenue.
Assisted Revenue
Assisted Revenue is revenue generated when Relewise has helped the user navigate the site via recommendations, but where the user ultimately did not purchase the recommended product. If a user goes to product A, sees product B in a recommendation slider and clicks on it, and ultimately buys product C, the sale is registered as Assisted revenue; Relewise helped the user navigate the site and broaden their horizon of the product catalog, but the recommendations did not directly lead to a sale.
Direct Revenue
Direct Revenue happens when a user engages with a Relewise recommendation, puts the recommended product in the cart, and completes the order.
Location Performance
The Location Performance overview offers insight into how your various recommendations are performing across the locations being tracked on your website. Being able to correlate a recommendation type to a particular location enables you to better understand what recommendations are performing well, and what areas might be in need of improvement.
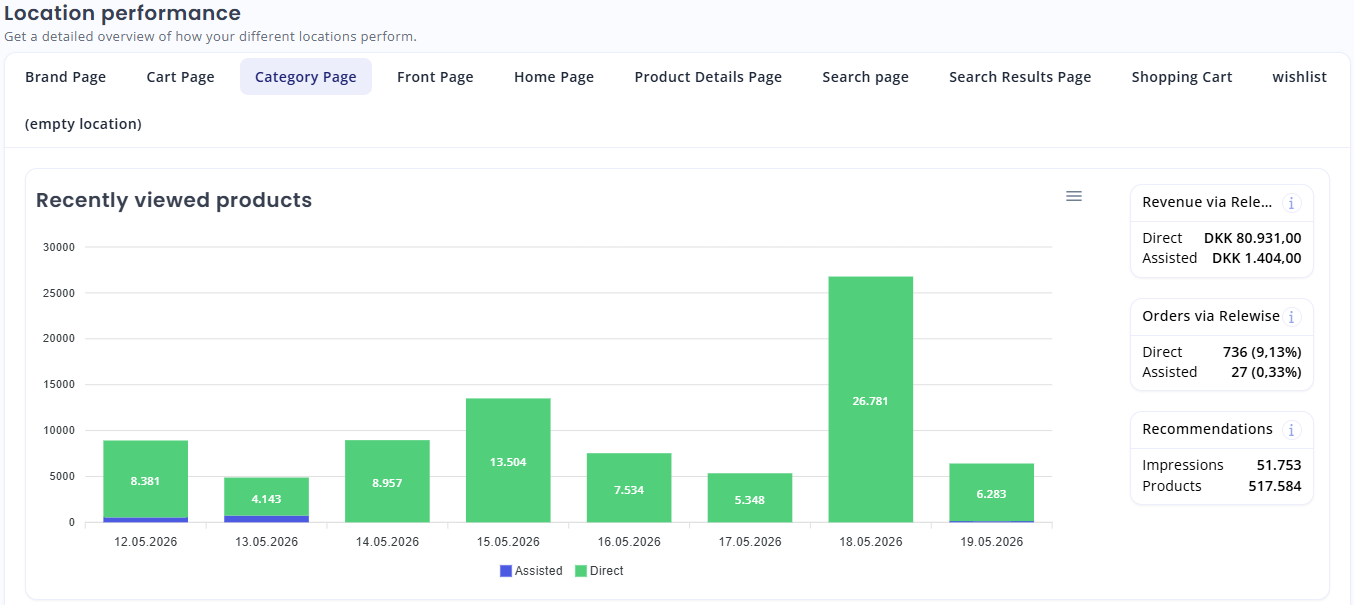
Performance metrics for a location with two personalized elements
Each location displays all of the various recommendation types that have been tracked to it within the given time period. For each graph, you can see the following details:
Revenue via Relewise
The total revenue from orders that included at least one product that was personalized by this recommendation type in this location. If the user purchased the product recommended to them, it is counted as Direct Revenue. If they merely used it to navigate the site, but still placed an order for different products, it is counted as Assisted Revenue.
Orders via Relewise
The total amount of orders that included at least one product that was personalized by this recommendation type in this location.
Recommendations
The total number of products presented to users by this recommendation type in this location.
Search Analytics
Search Analytics is a tool used to gain insight into the search behavior of your users. To learn more about Search Analytics, see the Search Analytics page.
Product Performance
Product Performance allows you to view the performance level of your best and worst achieving products. The view is split into five distinct categories:
High Potential: Product with low traffic but high conversion rates.
Trending Up: Products that performed well/showed the greatest growth rate over the previous period. A period here is defined as the interval chosen at the top of the page, and this performance metric measures the previous period of the same length as what is currently selected.
Top Selling: Products with the highest conversion rates.
To Improve: Products with high traffic but low conversion rates.
Cart Openers: Products that are typically the first to be added to a user's basket.
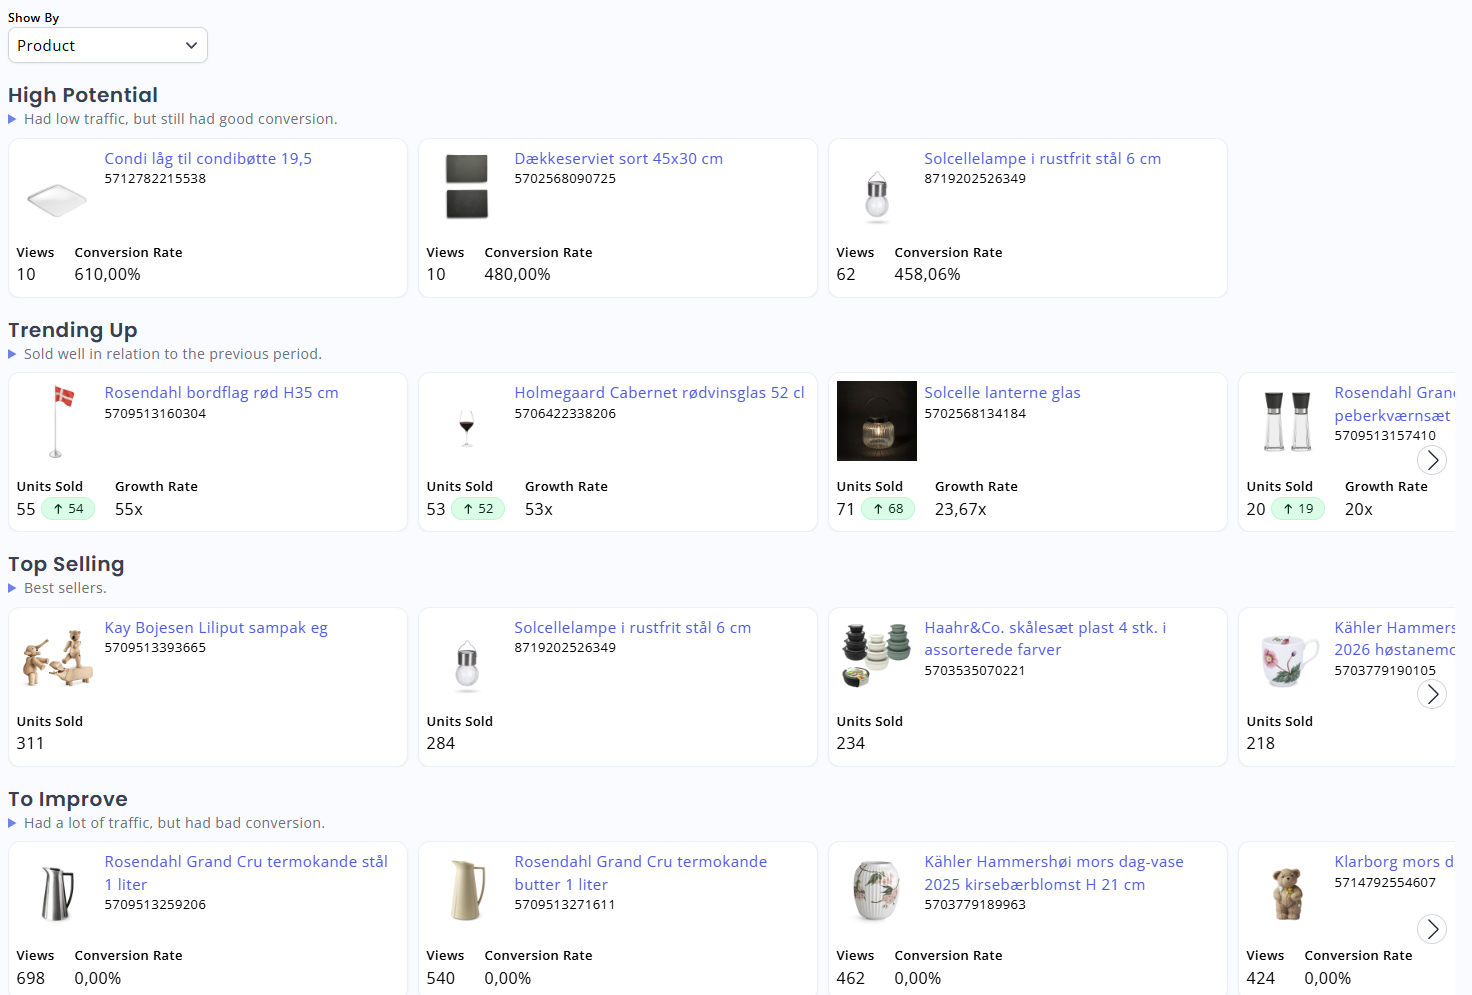
The Product Performance page offers a holistic overview of your products
Analyzers
If you are using Analyzers via Relewise, the Analyzers page lets you follow their performance in real time, as well as graphed over time.
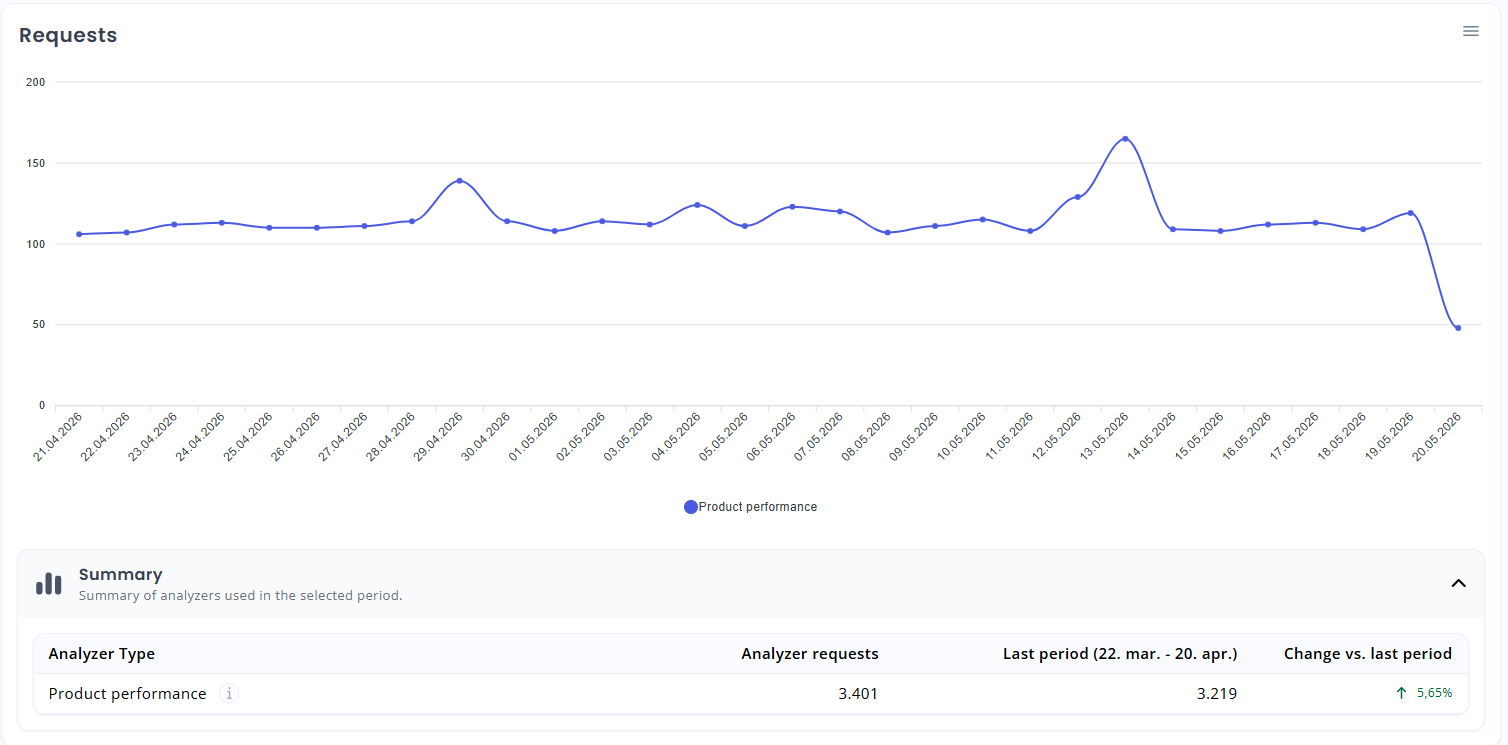
The Analyzers page affords you an overview of your active analyzers over time